Benefits Benchamarking Calculator

Is Your Benefits Package Competitive?

Free Benefits Benchmark Report

Not sure how your employee benefits stack up against companies your size?

Our free Benefits Benchmark Report compares your current benefits package against peers in your industry and state — powered by data from the U.S. Bureau of Labor Statistics National Compensation Survey & National Association of PEOs (NAPEO). See where you stand on health insurance, dental, vision, and 401k in 60 seconds.


free benefits benchmarking report

Start Here

Employee Benefits Benchmark Report
Free • Instant • Confidential

How Do Your Benefits
Stack Up?

Get a free AI-powered benchmark report comparing your benefits package to industry peers — in under 2 minutes.

Health Insurance Benchmark
Dental, Vision & 401k Score
PEO Savings Opportunity
1
Contact
2
Company
3
Benefits
Your Contact Info

Analyzing your benefits package...
Comparing against industry benchmarks in your state.

Your report is ready! We may reach out with a few tailored PEO options based on your results. No obligation.
-- /100
Grade: --
Analyzing...

See how you rank

What You'll Learn From Your Report

Your free Benefits Benchmark Report includes:

ACA Compliance Exposure

Your ACA compliance exposure if you're approaching or past 50 employees, including your estimated annual penalty risk
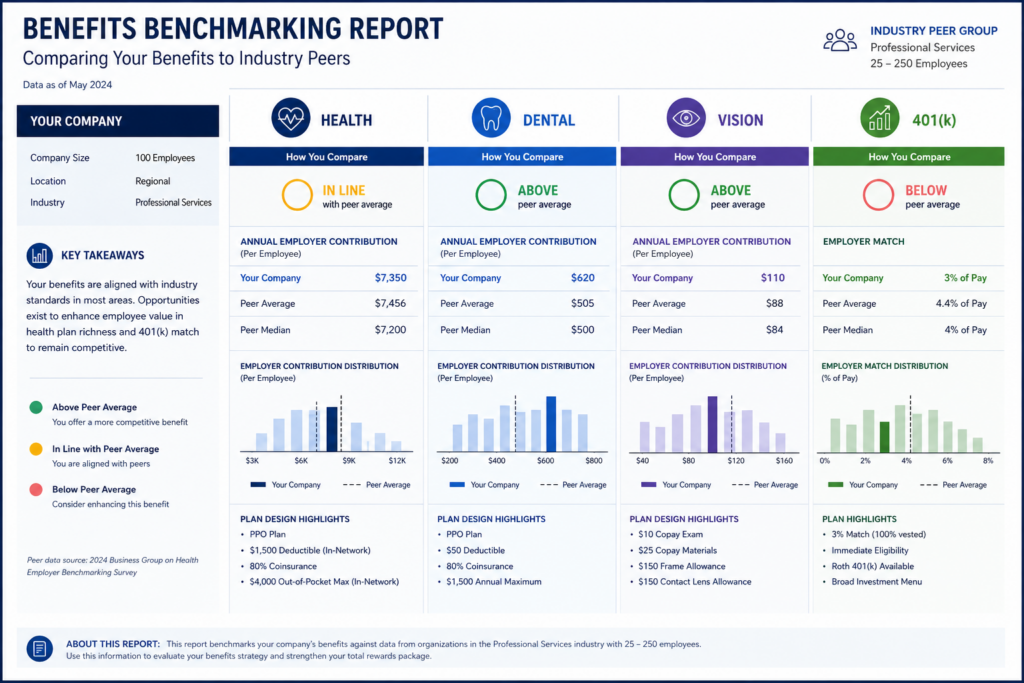
Peer Comparison

Peer comparison showing what percentage of companies your size offer health, dental, vision, and 401k — and what they pay

Cost Comparison

A side-by-side cost comparison showing what you're paying at individual small group rates vs what PEO group rates would cost for the same coverage

Readiness Score

A personalized readiness score and specific recommendations based on your industry, state, and employee count

Reliable Data

Our benchmarking data is sourced from the U.S. Bureau of Labor Statistics (BLS) National Compensation Survey and NAPEO industry research

Ready To Find the Perfect PEO Solution?

Compare & Save on Employee Benefits With

TOP PEOs LIKE...

Frequently Asked Questions

What is a benefits benchmark report?

A benefits benchmark report compares your company’s current employee benefits package against companies of similar size in your industry and state. It shows whether your health insurance, dental, vision, and retirement offerings are above, at, or below market compared to your peers.

This report is valued at $500 and it’s yours completely free. No credit card, no obligation, no sales call required. You keep the report whether you work with us or not.

Our benchmarking data is sourced from the U.S. Bureau of Labor Statistics (BLS) National Compensation Survey, the Kaiser Family Foundation (KFF) Employer Health Benefits Survey, and NAPEO industry research.

Under the Affordable Care Act, businesses with 50 or more full-time equivalent employees must offer affordable health insurance coverage or face penalties of $2,880 per employee per year as of 2026. The benchmark report calculates your specific ACA exposure based on your employee count and current benefits

A Professional Employer Organization (PEO) pools your employees with thousands of others to negotiate health insurance at large group rates — typically 10-35% lower than what a small business can get on its own. The average PEO client saves $1,775 per employee per year according to NAPEO research.

Scroll to Top